How to make summaries from different segments in the Dashboard?
What is Smart Summary?
The Smart Summary feature similarly works like a Crosstab but for Open End questions.
Smart Summaries are AI generated summaries that allow you to view verbatim summaries based on the total sample (Total), side-by-side with the contrastive summary based on different subgroups or Segment Variable(s) you have selected. For an in-depth walkthrough, watch this video!
Smart Summaries are AI generated summaries that allow you to view verbatim summaries based on the total sample (Total), side-by-side with the contrastive summary based on different subgroups or Segment Variable(s) you have selected. For an in-depth walkthrough, watch this video!
How to set it up?
1. In the Smart Summary page, select the OE question (as Rows) you'd like to generate summaries in the Open End Questions drop down.
- Users can select multiple open ended questions (in a single row), if you want to have a "combined summary" for the selected open ends questions. Users can also rename the summary by clicking the pencil icon (i.e. Combined Drivers and Opinion)
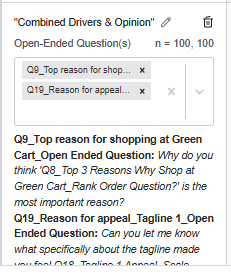
- Users can select multiple open ended questions (in a single row), if you want to have a "combined summary" for the selected open ends questions. Users can also rename the summary by clicking the pencil icon (i.e. Combined Drivers and Opinion)
2. Select the Closed Ended questions (as Column) that you'd like to select segment variables for.
- To add another segment click Add Column by hovering to top corner of Segment Variable box. The generated summaries for each column or Segment variables will be independent.
- To add another segment click Add Column by hovering to top corner of Segment Variable box. The generated summaries for each column or Segment variables will be independent.
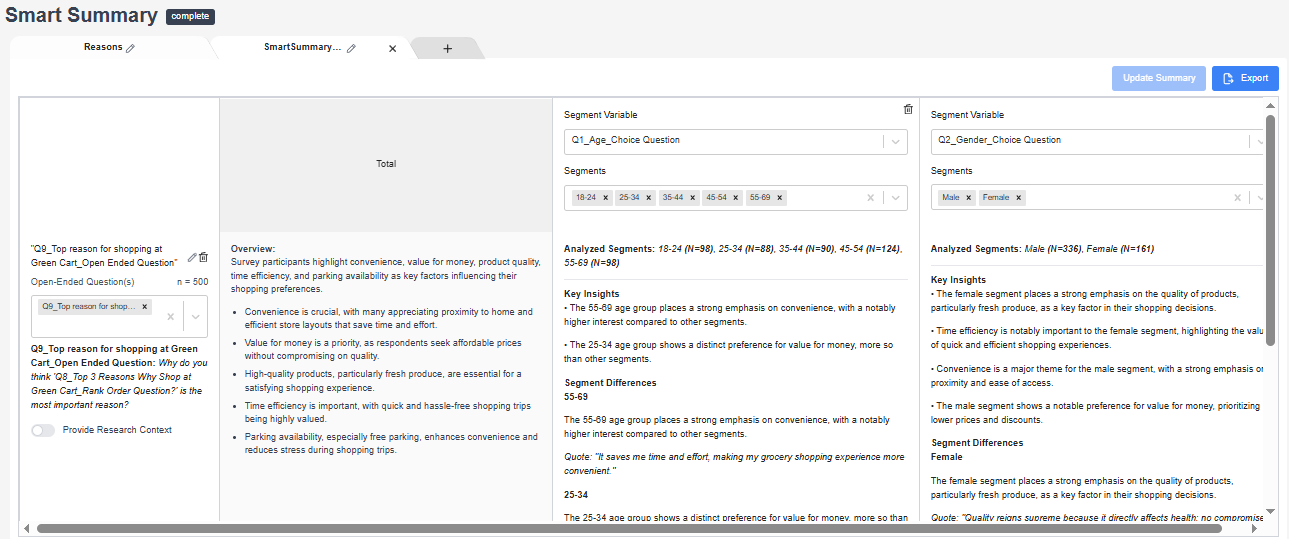
- For example, if we add Age and Gender to the segment variables, the summaries will show by Age, and by Gender separately. The results/analysis will not be combined for Age AND Gender.
- Please note that segments that have sample size less than n=5 will not be included in the key insights.
3. Click generate summary to generate your insights.
- Please note that segments that have sample size less than n=5 will not be included in the key insights.
3. Click generate summary to generate your insights.
- In the Generated summary, the output will have summary for the Total column and Segment Variable column(s). Specifically for the Segment Variable column, the output will have key insights, as well the highlighted segment differences along with illustrative quotes.
- How are the quotes picked?
The prompt asks the AI to “find 1–3 representative verbatim quotes that illustrate how respondents expressed the theme” - so the emphasis is on representative, not necessarily most common. For example, if males tend to speak more about Theme A, we would choose a quote from a male respondent that best represents how that theme was expressed.
4. You can add Research Context to generate more specific summaries and cater your key insights to your research objectives. After updating your settings you have to click generate to update all your fields.
- When a single OE question is selected and no user brief is provided, please note that the summarization that appears in the total column is not exactly the same one as the seen dashboard for that question. Please note they may not be exactly the same but the differences are minor.
5. Users can create multiple tabs to organize your questions and rename them to your liking as well
6. Results can be exported in excel
Other Notes:
- What languages are supported for Smart Summary?
- Processing works same as AI Coding, i.e. we use machine translations, and so in that sense all inca languages are supported. - Can analysis variables created post data collection, such those created for crosstab, be used as segment variables/banner points?
- No analysis variables cannot be used as segment variables/banner points in Smart Summary for now. The supported question types are: SINGLE_CHOICE, SCALE, CAROUSEL, MAP, VIRTUAL (only supported when the options are mutually exclusive).
Related Articles
How to make data tables or crosstab in the Dashboard?
What is a CrossTab? The Crosstab feature is a useful analysis tool commonly used to compare the results for one or more questions/variables with the results of another question/variable. Crosstabs (cross-tabulation) are basically data tables that ...SmartCoding on the Dashboard - Overview
What is inca SmartCoding? In this tool, you can add/remove/edit/merge the codes generated by the AI model for your open-ended verbatim. For the coded data, users can either export them to SPSS or CSV data file and run tables in their preferred ...How to filter data in the Dashboard?
In the Dashboard, FILTERS are useful analysis tool that allows you to filter the responses from the total sample and show only the data for a certain group/segment or data set that you have selected. How to set it up? 1. You can use the Filter ...How are voice and video responses analyzed on the dashboard?
The Media Count feature tracks the total number of individual media uploads per open end question. This includes open end questions where Voice or Video responses are enabled. In the project dashboard, go to the open end question card and in the drop ...How the data is analyzed and visualized for Open Ended Questions?
On the dashboard REPORT PAGE, the text analytics using AI run three different models for the open-ended verbatim -- Summaries, Themes and Keywords. As such, users can see three types of visualization for the standard open end question: Summary The ...